
A massive 41% of all people across the EU 28 member nations exercising freedom of movement rights between 2012 – 2014 used them to relocate to the UK, ten times more than move to France and double the number for Germany. In his EU renegotiations the Prime Minister, David Cameron, completely failed to get any concessions that would control and reduce EU mass migration to the UK and he also failed to arbitrate an agreement with the European Union to reduce social security entitlement to members of EU states outside the UK. So why has the leave campaign chosen consistently to put out the simple message without analysis that we cannot control immigration while being a member of the European Union? The problem with the leave campaign is that it is run by career politicians who do not wish to alienate potential voters both foreign and domestic. This is why the leave campaigners are less than forthcoming with economic facts showing why the UK is more attractive to poor migrants than other EU major economies. Migration outcomes are published on the EU’s Eurostat website and show that between 2012 and 2014 more than one million persons took up residence and worked in an EU Member State other than their country of citizenship. Of these, 41.2 % took up residence and worked in the United Kingdom, 21.6 % in Germany, 7.7 % in Belgium, 4.5 % in Austria and Spain, 4% in France 3.6% in Ireland, 2.9% in Sweden & 2.6% in Denmark.
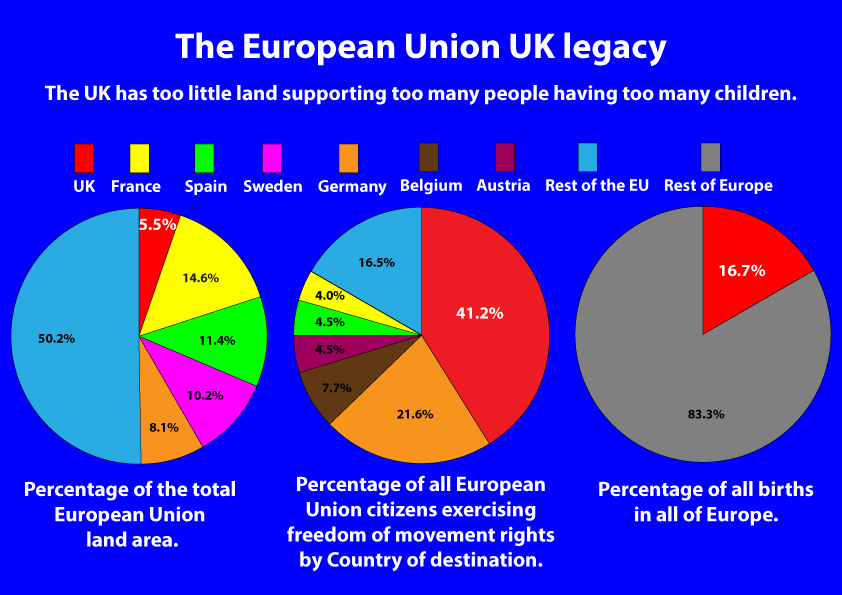
The UK burden of EU freedom of movement: Source official EU Eurostat website
The Eurostat website also publishes figures on wages and labour costs across the EU these show that in 2014 Denmark, Belgium, Sweden, Luxembourg, France, Netherlands, Finland, Austria, Germany, Ireland and Italy all paid higher wages as a component of hourly labour costs than the United Kingdom did. On paper then it is clear that eleven EU countries should be a better financial draw to migrants from poorer EU Countries than the UK is because they pay higher wages and salaries.
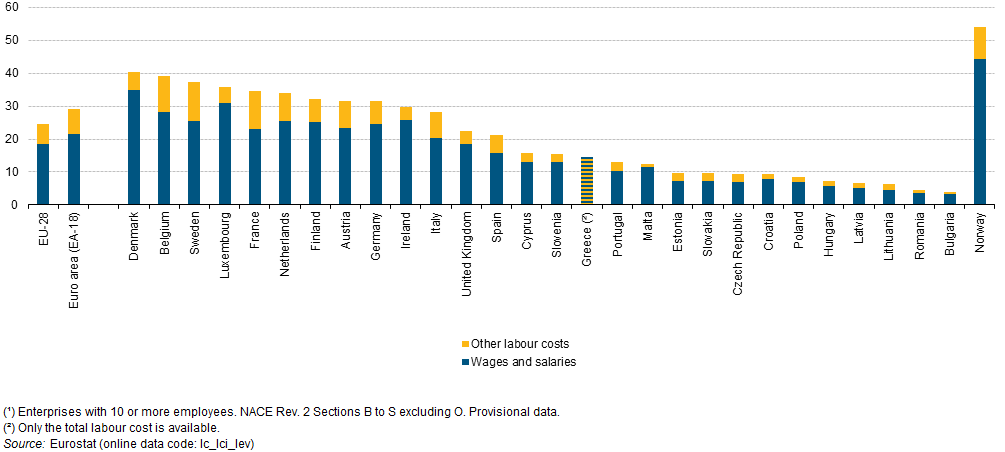
Hourly labour costs 2014 across the EU
The game changer for the UK is social security and let us be clear we are not talking about unemployment benefits such as JSA which in Oldham costs less than 1% of the tax credit bill which in the UK costs a total of over thirty billion. Other benefits attracting poor migrants are housing benefit costing over twenty five billion a year and child benefit costing eleven billion and we have the NHS, which is being pushed to breaking point not by budget cuts as claimed by the liberal left but by a huge, rapid and unnatural increase in population. It is our modern day culture of non-contribution that the leave campaign are avoiding tackling when they fail to detail why the UK is attracting such high levels of migrants and it is a modern day norm that is not repeated in the EU’s most successful economies. The tax wedge is a measure of the burden of tax and social security contributions relative to labour cost and we are providing this information relative to low-wage earners using Eurostat data from 2013. The lowest tax burdens for low-wage earners were recorded in Malta (population 423,000) at 19.2%, Ireland (population 4,588,000) at 21.5% and the United Kingdom (population 64,100,000) at 26.8%. In direct contrast to the UK ten (excluding Ireland) of the eleven EU countries paying higher wages than the UK placed tax burdens on low-wage earners at the following higher rates: Denmark 36.6%, Belgium 50%, Sweden 40.9%, Luxembourg 30.1%, France 45.6%, Netherlands 32.3, Finland 37.6%, Austria 44.6%, Germany 45.1% and Italy 44.9%.
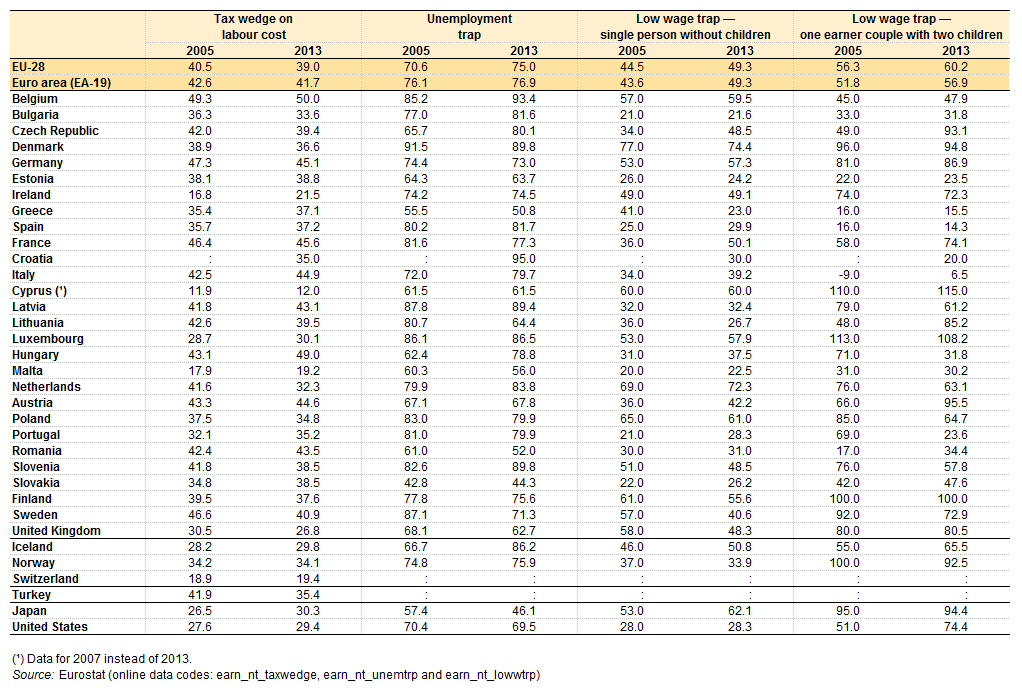
Tax rate indicators on low wage earners, 2005 and 2013
Why, if you were an unskilled poor economic migrant, would you not chose to live in the UK rather than Germany where the tax burden would cost 40.6% more? For those not entitled to huge sums in tax credits and other “family” based benefits it is clear that in recent years the UK liberal left collective joined the traditional conservative centre right in all but abandoning the minimum wage full-time working indigenous and migratory single or childless poor. These people are forced to suffer constricted pay as a direct result of other peoples in-work benefit payments that they are not entitled to while witnessing self-proclaimed political champions of the “working class” contradictory criticism of proposed tax credit cuts and increases in the minimum wage. The ONS release in 2015 showed that in the UK, almost half (46%) of those in single adult households experienced poverty at least once in the four years between 2010 and 2013 compared with less than a third of those living in households with two or more adults. Almost 40% of those aged 65 years and over in the UK experienced poverty at least once between 2010 and 2013. Almost a third (33%) of the UK population experienced poverty in at least one year between 2010 and 2013, equivalent to approximately 19.3 million people.
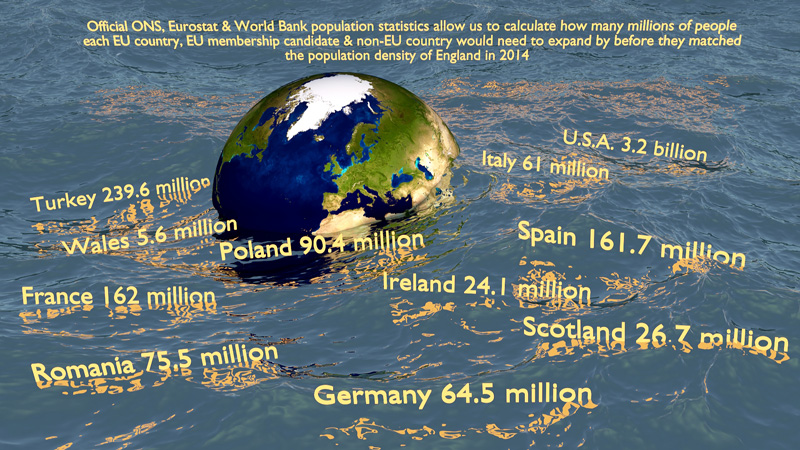
How many million of people it would take for Countries to match England’s population density in 2014